Yards Per Play Explained: The One Stat I Check First
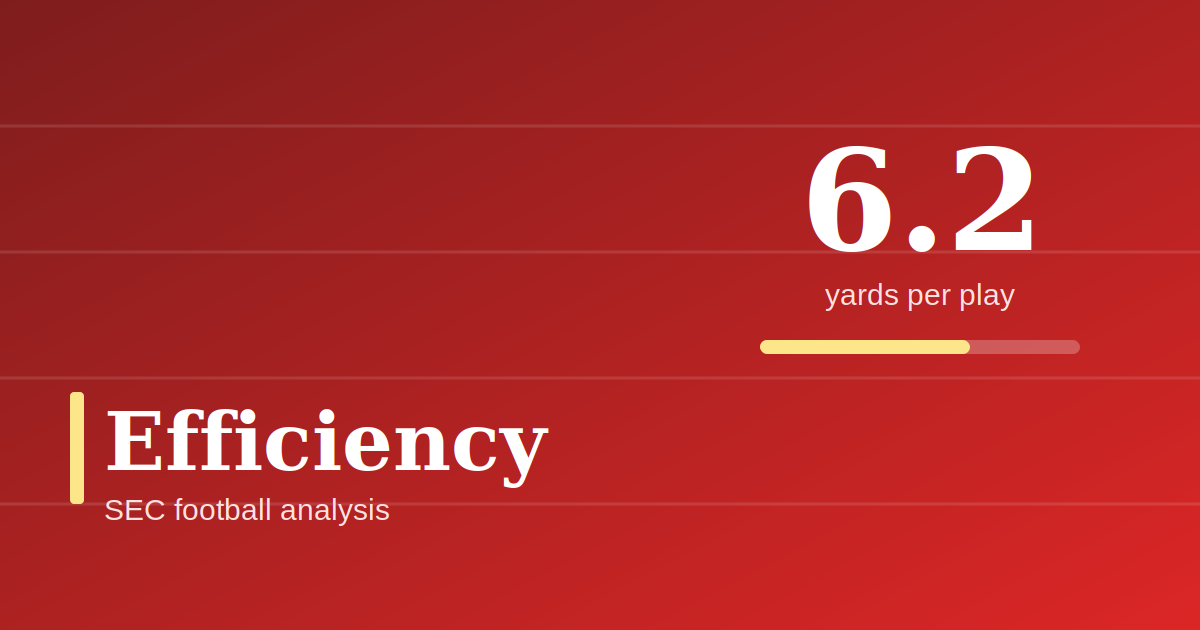
Yards per play is the first number I check after any game. It tells you how much ground an offense gained each time it snapped the ball. The stat cuts through the noise that totals hide.
The formula takes seconds. The skill lies in the traps, such as pace, garbage time, and averaging the wrong way. I cover each one and show how to turn the stat into a weekly habit.
Key takeaways
- Yards per play equals total yards divided by total plays. A 458-yard game on 74 plays gives 6.2.
- Subtract yards allowed per play from yards gained to get the margin.
- Add the totals, then divide once. Never average weekly averages.
- Read late-game numbers with care when the score is lopsided.
The formula in one line
Yards per play equals total yards divided by total plays. In college football, the plays are rushes (sacks included) plus pass attempts. Suppose a team gains 458 yards on 74 plays. The math is 458 ÷ 74, which gives 6.19, or 6.2 when rounded.
That figure means the offense moved the ball a little more than six yards each time it ran a play. A first down needs ten yards in four tries. An offense that holds a 6.2 average will often stay ahead of the chains.
| Team | Total yards | Plays | Yards per play |
|---|---|---|---|
| Team A | 458 | 74 | 6.2 |
| Team B | 341 | 62 | 5.5 |
| Team C | 400 | 80 | 5.0 |
| Team D | 350 | 55 | 6.4 |
Look at Teams C and D. Team C gained more yards, but Team D was more efficient. The extra 25 snaps gave Team C the bigger total. Per-play math removes that advantage.
What counts as a play
A play, for this stat, is a snap from scrimmage. Runs, pass attempts, and sacks count. Punts, kickoffs, and field goal tries do not, since they are special teams plays. Sources handle a few rare cases in different ways, such as kneel-downs and spikes. Check how your data source treats them, and stay consistent from week to week.
Consistency matters more than perfection. If you compare two teams, use the same source for both. Mixing sources can shift a number by a tenth of a yard or more, and that can flip a close call.
Why yards per play beats yards per game
Yards per game measures volume. Yards per play measures quality. A team that runs 85 plays and averages 4.7 yards earns 400 yards. A team that runs 55 plays and averages 6.4 earns 352. The first team looks better in the box score total, yet the second team plays at a higher level on each snap.
Volume depends on tempo, turnovers, and game flow. Quality depends on the offense itself. When you want to rate a unit, quality is the better question. My box score guide shows where to find both numbers on the page.
Offense, defense, and the gap
Every game produces two yards-per-play numbers. One belongs to the offense of each team. The same pair also describes the defenses, because one team's offense is the other team's defense. Subtract the yards per play a team allowed from the yards per play it gained. The result is the yards-per-play margin.
Here are five sample games to show how the margin works.
| Game | Offense | Defense allowed | Margin | Final score margin |
|---|---|---|---|---|
| 1 | 6.5 | 5.0 | +1.5 | +10 |
| 2 | 5.2 | 5.8 | -0.6 | -3 |
| 3 | 7.1 | 4.4 | +2.7 | +24 |
| 4 | 5.9 | 5.9 | 0.0 | +3 |
| 5 | 4.8 | 6.3 | -1.5 | -14 |
These numbers are made up, but they show a common pattern. The margin tracks the final score closely. Game 4 is the exception, and it makes the point that one game is noisy. The five-game average margin is +0.42, and the average score margin is +4.0.
Average the totals, not the averages
Season-long yards per play needs one small rule. Do not average the weekly averages. Add all the yards, add all the plays, and divide once. A short example shows why.
In game one, a team gains 450 yards on 70 plays, which is 6.43. In game two, it gains 300 yards on 60 plays, which is 5.00. The simple average of the two figures is 5.71. The correct number is 750 ÷ 130, or 5.77. The gap is small here, but it grows when game lengths differ a lot.
Pace and tempo
Pace is how many plays a team runs per game. A fast team may run 80 plays, and a slow team may run 60. That is one-third more chances. Pace does not change yards per play directly, but it changes the totals around it, so it explains why per-game numbers jump around.
Track pace in a separate column. A team with a high yards-per-play number and a slow pace may be efficient but limited by few snaps. A team with a modest average and a fast pace may pile up points through volume. Both profiles can win, and they need different plans.
Garbage time
Garbage time is the stretch late in a lopsided game when backups play. The trailing team may throw on every down. The leading team may run the clock. Neither side acts normally, so the per-play numbers drift.
One quick fix is to note the score at the start of the fourth quarter. If the margin is larger than about three scores, read the late numbers with care. Where play-by-play data exists, you can remove those snaps and recompute. That extra step makes the stat cleaner, but it is optional for casual use.
Explosive plays and steady gains
An average hides how the yards arrived. Two offenses can post the same 6.0 through very different paths. One may gain five yards on almost every play. Another may gain two yards on most plays and break a handful of long ones. The second offense is more volatile, and a bad day without big plays can sink it.
Count the explosive plays in each game. Many analysts mark any run or catch of 20 or more yards as explosive. Then compare the share of yards that came from those plays. My guide on rushing and passing stats adds success rate to the picture, which tracks steady gains.
Points per drive: the next layer
Yards do not score points by themselves. A second stat shows how well an offense turns yards into scores. Points per drive equals points scored divided by drives. If a team scores 31 points on 12 drives, the figure is 2.58.
Compare the two stats side by side. A team with strong yards per play but weak points per drive wastes yards. It may be stalling in the red zone or giving the ball away. A team with weak yards per play but strong points per drive is converting efficiently, maybe thanks to short fields. The gap is a clue to look deeper.
Adjust for the opponent
A 7.0 average against a weak defense is less impressive than 6.0 against a strong one. To adjust, compare each game with the opponent's season average allowed. If a defense often allows 5.5 and your team gains 6.5, the difference is +1.0. Repeat for every game and average the differences. My schedule guide explains how to rate opponents.
A weekly routine
- Record yards and plays for both teams after each game.
- Compute yards per play for each side.
- Subtract to get the margin.
- Note the pace and the score at the start of the fourth quarter.
- Update the season total by adding yards and plays.
- Write one line on what the numbers say.
The routine takes ten minutes. By midseason, you will have a table that shows which teams are better than their record and which are not.
Using the stat in a projection
Yards per play margin helps you set win chances. A team with a +1.5 margin over a long stretch is likely stronger than a team near zero. Use that gap to move your numbers up or down, then feed the chances into the season projection. Treat the step as judgment, not a formula, because no simple rule converts margin to win chance without testing.
You can test it yourself. List a season's games with the yards-per-play margin and the final score margin. Check how closely they move together. If the link is tight for your team, you can trust the stat more.
The defensive side of the stat
Yards per play allowed works the same way in reverse. A defense that allows 5.0 per snap is stronger than one that allows 6.0. The gap looks small, yet one extra yard over 70 plays adds up to 70 yards, which is almost a full extra scoring drive. Defenses that force punts and negative plays keep this number low, so check tackles for loss and sacks alongside it.
Splitting the stat into running and passing
Yards per play blends two styles. You can break it apart with a weighted average. Multiply the run share by the yards per carry. Multiply the pass share by the yards per attempt. Add the two. Take a team that runs on 55.9 percent of its plays at 5.0 per carry and throws on 44.1 percent at 8.3 per attempt. The math is 0.559 × 5.0 plus 0.441 × 8.3, which is 2.80 plus 3.66, or 6.46. The direct calculation of 440 yards over 68 plays gives 6.47, so the two methods agree.
The split tells you where to look when a number drops. If the run average falls but the pass average holds, the problem is up front. The reverse points to protection or receivers.
How many games before you trust it
One game holds about 70 plays per team. That is a small sample, and a single long play can move the average by a tenth of a yard. After four or five games, you have 280 to 350 plays, and the picture gets steadier. Until then, blend last season's numbers with the new ones, and lean on the new data as the games pile up.
Why I still watch the games
A number cannot show a missed block or a dropped pass. I use yards per play to find the questions, then I watch the film or highlights to find the answers. When the stat and the eye test disagree, I look for a cause before I trust either one. An injury or a change in play calls is a common reason.
Split your SEC numbers into two columns
Keep one column for league games and one for nonconference games. Three nonconference games can lift an average built against weaker opponents. In my view, a 6.2 against SEC defenses says more than a 7.0 against a soft opener.
With nine league games, each one is 11.1 percent of the league sample. One outlier game can move the number fast, so check the two columns separately.
My take
My rule of thumb is simple. A gap under 0.3 yards per play is noise in a nine-game sample. A gap above 1.0 is a real edge. This is a rule of thumb and not a statistical test.
The numbers I ran
I turned an edge in yards per play into yards on the field. The last column adds up nine league games at 70 plays each.
| Edge | 60 plays | 70 plays | 80 plays | 9 games at 70 plays |
|---|---|---|---|---|
| 0.25 | 15 | 18 | 20 | 158 |
| 0.5 | 30 | 35 | 40 | 315 |
| 1.0 | 60 | 70 | 80 | 630 |
| 1.5 | 90 | 105 | 120 | 945 |
A 1.0 edge is worth 70 yards in one game and 630 over a league season.
Common mistakes
- Comparing total yards without looking at plays.
- Averaging weekly averages instead of totals.
- Counting special teams snaps as plays.
- Reading garbage-time numbers as normal.
- Judging a team on one game.
- Switching data sources midseason.
Often asked questions
How do you calculate yards per play?
Divide total yards by total plays. In college football, plays include rushes (sacks included) and pass attempts.
What is a good yards per play in college football?
Higher is better, and the margin against the opponent matters most. Compare each team with its own opponents and with the season average.
Why is yards per play better than yards per game?
It removes the effect of tempo. A fast team can pile up yards through volume without being more efficient.
Do special teams plays count?
No. Punts, kickoffs, and field goal tries are not scrimmage plays.
How do I find a season average?
Add all yards, add all plays, and divide once. Do not average the weekly averages.
What is garbage time?
It is the late stretch of a lopsided game when the score changes how teams play. Numbers from that time can mislead.
What is the yards-per-play margin?
It is the yards per play a team gained minus the yards per play it allowed.
How does points per drive differ from yards per play?
Points per drive shows how well an offense turns yards into scores. Yards per play shows how well it moves the ball.
The takeaway
Yards per play gives every offense and defense the same yardstick. Calculate it from totals, track the margin, and add pace and points per drive for context. Then watch for the cases where the stat and the eye test disagree, and find out why.